Author Archives: Felipe Botero

What is engagement on Facebook and why is it important?

Customer engagement in Facebook has emerged as a topic of great interest for consultants and marketing managers due to their interest in finding out about the nature of the connections between online brand communities and their target audience and to understand which factors determine the engagement factor among brands and followers in this social network.

Traditionally, Facebook has portrayed the engagement factor as the sum of certain metrics contained in its social plug-ins, such as the number of reactions (like, love, laugh, surprised, sad and angry), comments and amplifications (shares) divided by the total number of likes of a certain fanpage.

Such measurement seeks to determine the degree of connection and empathy between the actions developed by brands and their followers. However, for some marketing professionals such variables don’t describe other important elements that also affect the way in which their content captures followers’ attention or to find relevant insights that reflects brands’ ability to engage customers.

Other ways to determine engagement in Facebook.

Multiple methodologies have been developed by marketing researchers with the idea of expanding the spectrum of possibilities that help to understand the engagement factor in Facebook, ranging from mathematical models that aim to measure certain “key performance indicators” (KPI’s: Key Performance Indicators) to theoretical methodologies based on advertisement and psychology theories.

For instance, some methodologies embrace engagement from the analysis of the interactions between the brands and their followers in Facebook, categorizing the posts that communicate humor, emotions or the brands’ philanthropic actions as a high engagement generators while the content that communicates prices and items availability as low engagement generators.

In the other side, some methodologies propose mathematical models based on the measurement of a matrix of variables such as:

  • The number of “posts” published during a given campaign.
  • The number of followers of a publication.
  • The number of videos, pictures and links shared.
  • The status updates of the Facebook campaign or brand page.

Even though, these methodologies try to evaluate Facebook engagement from various areas of knowledge, they don’t delineate a holistic approach that encompasses theories from different sciences combined with a statistical model.

The development of more comprehensive methodologies, can help marketers to obtain more in-depth insights about how is engagement created in Facebook and to determine which key factors characterize the relationships between online brand communities and their followers on Internet-based applications.
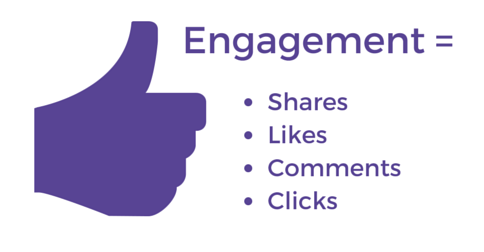
Facebook engagement variables

Facebook engagement variables

Why listening to your customers is important when creating content marketing?

The development of the Web 2.0 has allowed users and brands to interact and collaborate with each other through the construction of a dialogue mediated by social media platforms.

Similarly, it marks the surge of “content marketing” as a business communication strategy that helps companies to create and distribute important, relevant and consistent content using different internet channels in order to acquire a defined target public with the goal of driving profitable consumer response.

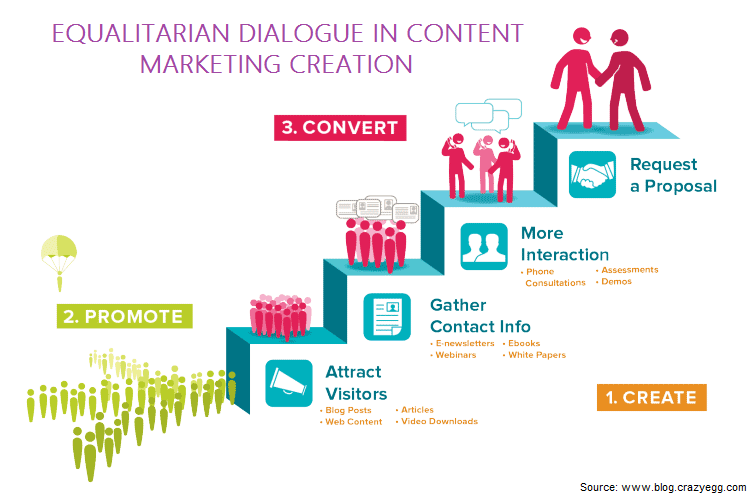
Thus, content marketing communication strategies focus on delivering information, constructed in an egalitarian dialogue approach, meaning that if traditional marketing attempts a one communication persuasion scheme to initiate and close a sale, content marketing is about helping buyers to make pragmatic and informed buying decisions while constructing a dialogue in which contributions are considered according to the validity of customers reasoning, instead the status or power position of the brands.

As stated in a study performed by the Content Marketing Institute (CMI), if brands want to succeed in creating relevant, engaging content marketing, they need to invite customers to shape the brand activities through a strategy of “active listening”. Moreover, customers are in constant dialogue with companies using social media platforms and their discourse and interactions help to create meaning to the marketing actions of the brand.

In addition, the CMI research elucidates that consumers are actively gathering information to really determine if a brand’s value proposition is consistent with its marketing communication strategy of fulfilling customers needs and expectations.

There has always been the power of referrals and peer-to-peer word of mouth and technology makes it much easier and more scalable for opinions to be formed quickly and perceptions to be influenced.

Why content marketing strategies should be created on an egalitarian dialogue approach?

  • A content marketing strategy based on an egalitarian dialogue interaction can help companies to address customers’ needs and expectations in a more efficient way as it considers customers’ comments and reviews the main source of information about the brand image and its perception.
  • Exploring users-generated content, insights and opinions through an egalitarian dialogue approach, helps to construct meaning to the marketing and communication actions of the brand and encourages customers to be active players in the evolution of the brand.
  • Learning about brand followers and consumers profiles applying the concepts stated in the egalitarian dialogue communication theory, leads not only to a better content marketing creation but also to improve other companies’ marketing interactions such as consumer experience and engagement.
  • Since brands are interacting more actively in social networks and other digital communication platforms, the concepts of brand image and product knowledge are no longer exclusive constructs of companies’ business activities. Both concepts mean different things to different users at different times and places and its meaning should be shaped mutually by customers and brands and not just imposed by the brand.

The web 2.0 has changed old paradigms about the traditional one way communication approach. The concept of egalitarian dialogue in the creation of content marketing has encouraged customers to be active participants in developing the brand’s marketing activities, to develop consensual actions between the brand and the customers in social media environments and to develop new communication dimensions that help to improve companies’ different business actions.

Content marketing creation process.

Equalitarian dialogue in content marketing creation.

What is the importance of Big Data in public transportation?

The current trend of some companies to use Big Data analytic tools in order to create predictive models of business intelligence is a reality that is impacting the managerial processes in different business environments. However, the fact that the public sector is using more often Big Data analytics to foresee citizens’ needs, change the traditional government management approach that has been in place for decades.

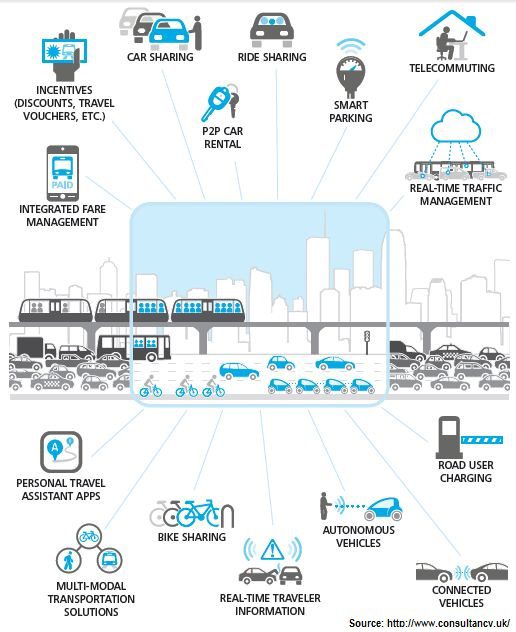
A specific case that elucidates how municipal governments are employing Big Data analytics in their management processes happens in the department of transportation of the city of London, England; TfL, the local government body responsible for the city’s transportation system. This municipal agency has implemented a Big Data analytics strategy that helped to find predictive behaviors of transit users, to identify the needs of the city transportation infrastructure and to improve the agency’s decision making processes.

Similarly, through partnership agreements with different businesses of the city of London, TfL encouraged public transportation users to download a mobile phone application about routes and timetables in their smartphones. The information generated in such app, was intersected with databases that contain information related to routes frequencies in peak hours, routes with greater passenger mobility and annual number of trips per capita using TfL services.

Which aspects of the public transportation in the city of London improved from using big data?

  • Transportation user experience: After the analysis of large data sets, Tfl could answer questions such as: What is the main purpose of London citizens to use transit systems? What is the preferred mode of transportation among transit users? What is the main source of information used by citizens to obtain information about routes and schedules and What are the main concerns of transit users about the city’s transportation system?
  • Mobility and sustainability: Using big data, Tfl could forecast important variables such as: transit systems future demand, citizens’ ride time using public transit, transportation network planning and its relationship with the environment (stops, routes and frequency), scope of intermodal transportations systems offered by TfL.
  • Infrastructure and street furniture: Analyzing large data sets of information, TfL could find out, the impact of new infrastructure in London’s mobility, the use of public space by transit system users and the social and environmental impact of public transportation systems.
  • Communications: Based on the amount of data generated through the interactions with TfL users, the agency could design strategies to improve the communication among TfL and transit users and to discover what technological platforms were more popular among citizens to communicate with TfL.

The use of Big Data analytic tools by the TfL, helped to bring effective solutions to the needs of public transit users and to identify the most prominent infrastructure and mobility problems of the municipality.

Transportation and big data

Transportation and big data

____________

The following article portrays the use of Big Data analytical tools to resolve the needs of public transportation systems in other cities in the world: https://channels.theinnovationenterprise.com/articles/big-data-s-impact-on-public-transportation

Why using visual metaphors improve big data visualization?

The popular adage that says: “a picture is worth a thousand words”, could be considered the statement that best explains the fact that a complex idea can be communicated with greater effectiveness through a graphical representation. Such adage can also be extrapolated to the concept of  big data visualization, as it is a communication instrument that helps to illustrate specific volumes of numeric text data in form of visual metaphors using different kinds of charts.

Usually, when communicating large volumes of data represented in numeric text, it becomes difficult for the human brain to symbolize its meaning using the verbal processing function that we employ to interpret daily life phenomena. Therefore, the graphical tools developed to display numerical data sets, allows the human brain to understand information more effectively through visual metaphors.

Likewise, it is pertinent to mention that analogies and metaphors are brain’s cognitive processes that play an essential role in abstract reasoning abilities and human communication. Human brain constantly uses previously acquired knowledge about things we are familiar with, to be aware of unknown phenomena. Thus, graphic metaphors are created in our minds to allow us to understand abstract concepts, such as numeric text data in visual terms.

Additionally, and in order to understand the meaning of a visual metaphor in the analysis of a numerical data set, it is important to remark that the symbols and the graphic resources employed to depict such data must describe numeric values in the most accurate manner. Otherwise, the information authenticity that is intended to be communicated by such data set might be misinterpreted by the final user.

The aforementioned ideas help us to deduce that there is a symbiotic relationship between the types of charts and the sets of numerical data to be analyzed, which influences the way numerical data sets must be presented in the charts and the way users’ perceive data information.

Important questions to ask before designing visual metaphors.

  • Does the chart aim to compare different values? Are the highest and lowest values of the data set clearly shown in the chart?
  • Does the chart aim to display the composition of something? Does the chart intents to show independent values as part of a whole set of data?
  • Does the chart intent to show the distribution of different values? Does the chart help to show statistics outliers, normal trends and the whole range of values expressed in the data set?
  • Does the chart intent to express the relationship between different groups of data sets? Does the chart show an interrelationship between different variables?

Data visualization greatest strength is that it empowers our brain capacity to process visual information more efficiently than numerical information. Therefore, if a visual metaphor is constructed following a systematic methodology that takes into account data accuracy and graphic coherence; it will communicate charts’ information comprehensively, generating at the same time confidence in the analyzed data by users.

Data visualization

Data visualization

What is the importance of online brand communities in product design?

The concept of community has been defined as a group of persons that build through different signs or actions a sense of identity and belonging to such group. This definition has taken new connotations since the emergence of the web 2.0 and the rise of virtual communities.

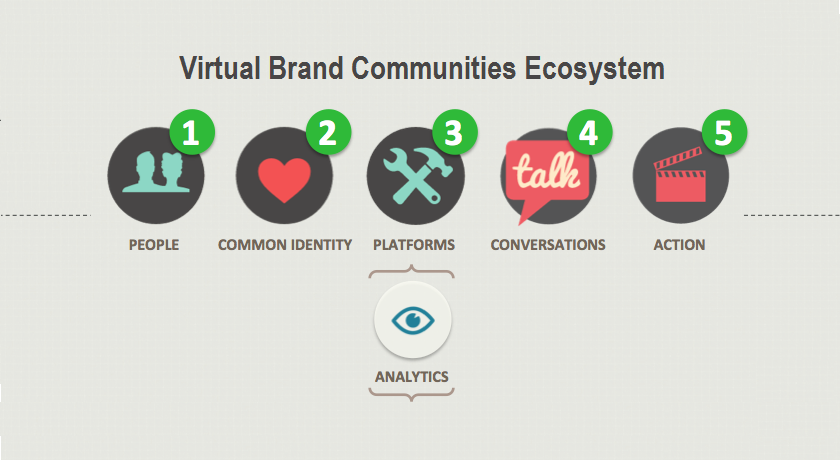
Within the fabric of meanings that describe virtual communities, the “online brand communities”, have spawned great interest among product engineers and marketing professionals as the interaction generated in such spaces have become significant sources of market intelligence.

Some theoretical principles of digital anthropology, suggest that if a group of consumers admire and follow a brand in a virtual community, a process of class consciousness is developed through multiple rituals that reproduce the sense of belonging to the community and foster the affective bonds among members and the brand.

For some companies, learning about online brand communities’ rituals and traditions has been crucial in order to gather key customers’ behavior information. Moreover, such learning approaches have helped companies to exploit the affective bonds that connect community members with the brand, generating dynamics of active participation with mutual benefits for both parties.

How can brands interact in online brand communities to design products?

A successful business case of active participation happened between the Danish manufacturer of plastic toys, Lego Corp. and the followers of the brand who interact in the online community; Lugnet (www.lugnet.biz). The interaction between Lugnet and LEGO Corp. is determined by LEGO’s necessity to know what kind of products Lugnet members would like the company to produce and buy.

In order to capitalize the interactions created with Lugnet, LEGO corp. designed a strategy aimed to encourage Lugnet members to participate in a contest to design different products that they would like LEGO corp. to produce.

During the contest, LEGO provided a software of prototypes to the community so members could design a specific product online and share the design with other members. Once the leaders of Lugnet in partnership with the engineering department of LEGO Corp. choose the winning model, the company developed the product, rewarding the most active members in the contest.

LEGO strategy of empowering Lugnet members to take part of its product design process was beneficial for both parts: On the one hand, LEGO benefited from gathering key business information that improves product sales and customer satisfaction. On the other hand, Lugnet members buy products designed by themselves while reinforcing the affective ties with the brand and with other community members.

online brand community ecosystem

Why is it important to generate trust for consumers in e-commerce stores?

E-commerce is an important enabling tool that helps businesses to expand their commercial operations beyond local markets. Throughout the world, small and medium-sized enterprises (SMEs) develop e-commerce platforms based on different business to consumers (B2C) strategies. However, the main challenge these SMEs might face when exploring markets overseas, is the trust perception of their e-commerce websites.

According to a survey carried out by the British digital consulting firm digital econsultancy.com about transaction credibility in SMEs’ e-commerce websites, 61% of the respondents, answered that they decline their intention to buy in SMEs websites, due to the lack of safe instruments that ensure reliable transactions.

How can ecommerce companies improve users’ trust perception in ecommerce websites?

  • Security certificates and safe electronic transaction check mark: These instruments are distinctive symbols that increase the perception of being in a place for safe commercial transitions, giving at the same time legitimacy to the e-commerce site. Companies such as Pay pal, McAfee or VeriSign offer handy and affordable security software to ensure safe SMEs’ e-commerce transactions.
  • Contact Information: This feature is an indication that there is a real person beyond the virtual environment that can help users in case something goes wrong with the electronic transactions on the e-commerce web site. A contact form, an email address, a phone number, and mailing addresses can help to increase the level of customer trust.
  • Consumers’ reviews and discussion forums: These two mechanisms give social legitimacy to the interactions that take place in the e-commerce site. When users’ comments and ratings are deployed, the level of trust and authenticity increases. Good and bad reviews help to build relationships of reliability with consumers and to improve the site reputation.

Trust perception might not be an issue that represents a risk for companies such as Amazon, ebay or Alibaba. However, the future of many SMEs that base their e-commerce business models on B2C strategies can be determined by their decision to implement mechanisms that enhance users’ perception of performing safe transactions in their websites.

trust in ecommerce image

trust in ecommerce image

Is Twitter a viable business?

Since its foundation in 2006, Twitter became one of the most useful tools companies have to communicate with their customers. By the year 2014, Twitter was the second most used social network service by companies in several markets.

However, different technology analysts have expressed their concerns about Twitter business viability due to current financial issues that are undermining investors’ trust in the future of the company.

In the year 2012, Twitter had 500 million subscribers who wrote an average of 340 million “tweets” per day. Most of the traffic is generated in highly globalized markets such as the United States (40%), Japan (23%), Spain (7%), England (6%) etc. That same year, Twitter search engine made 1.6 billion searches each day.

Yet, in the year 2015, eight years after its foundation, Twitter Inc. had not yet reached a break-even point (BEP) or the point at which cost or expenses and revenue are equal, even though for the same year the opportunity costs had been paid and capital has received the risk-adjusted expected return.

Twitter financial uncertainty 

Although, Twitter financial statements show annual profits, the uncertainty about its future as profitable business is still unclear. For instance, in the fiscal year 2013, Twitter’s net revenue were US $400 million, its shareholders investments during the same period was US $ 1.16 billion and its brand value was about US$ 8 trillion. Such numbers have made many financial analysts to believe that the company is highly overvalued.

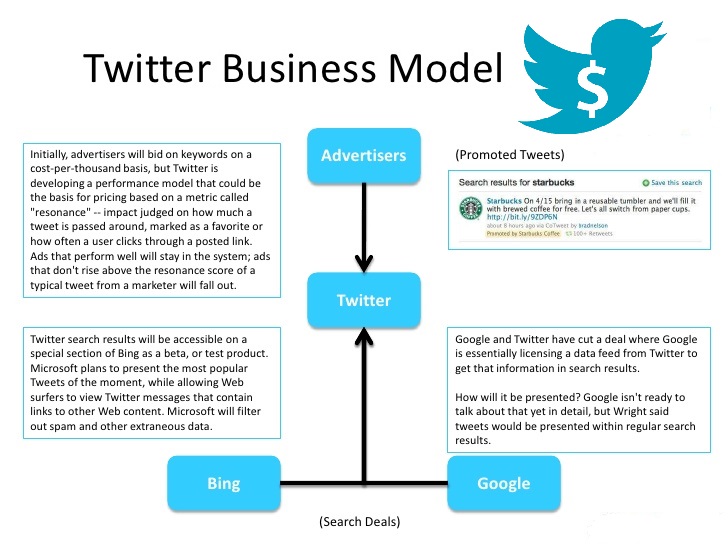
It is important to remember that Twitter’s main source of income is the sale of advertisement spaces within their site platform and the sale of the so-called “promoted tweets”. Therefore investors might be asking:

  • Should Twitter Inc. implement a business model that can help to increase the company’s profits? What alternatives can Twitter Inc. explore in order to improve its business efficiency from a financial point?
  • Which managerial strategies that have been used by other internet social networking service companies’ and that have proved to be successful, could Twitter Inc. undertake as an opportunity to redirect their financial statements?
  • Are Twitter Inc. future financial goals unattainable in the highly competed market of internet social networking services? Should Twitter Inc. consider the possibility of a business “take over” by other technology companies such as Facebook Inc. or Google Inc. in order to survive?
Twitter

Twitter Business Model